


By opting in you agree to receive emails from us and our affiliates. Your information is secure and your privacy is protected.
Stock
16-12-2025 19:02
0 Views
Bitcoin 2025 Crash: Why It Looks Different from 2022
Key Takeaways:
2022 was caused by crypto failures; 2025 was triggered by external macro shocks. Bitcoin fell far deeper in 2022 than in 2025, showing a milder decline this time. 2022 saw panic inflows to exchanges; 2025 shows stronger resilience and net outflows.Bitcoin is down 30% from its October all-time high near $126,200. The drop has revived an old question: is the bull market over, or is this only a mid-cycle correction?
On one hand, the downturn was triggered by external macro shocks rather than internal failures, and today’s market infrastructure appears stronger than in past cycles. On the other hand, ongoing macro uncertainty leaves room for a deeper or more prolonged slowdown.
Below we break down what happened, how it compares to past cycles, and what may come next.
What Happened in 2022
The 2022 crash began in May, when the Federal Reserve raised rates by 0.5%. Bitcoin traded at about $37,700 at the time. Within days, the TerraUSD stablecoin and its sister token Luna collapsed, wiping out more than $40 billion and sending shockwaves across the industry. Bitcoin fell to $28,900 by May 12, while Ethereum slid from $2,779 to around $1,700.
More failures followed: Celsius froze withdrawals, Three Arrows Capital collapsed, and FTX went under in November. By then, Bitcoin had dropped to $15,742 and Ethereum to $880. The total crypto market lost more than $1 trillion in value.
From start to bottom, Bitcoin fell almost 59%. The selloff deepened because of depegs, insolvencies, and high leverage. The recovery was slow and painful, setting the benchmark for what many now call a “crypto winter.”
What Triggered the 2025 Decline
The 2025 correction came from outside crypto. On October 10, President Trump announced a 100% tariff on Chinese imports. Markets reacted instantly. Almost $400 billion was wiped from the crypto market in just 24 hours, the largest daily loss on record.
Bitcoin had hit $126,200 on October 6 but fell to around $110,000 by the end of the month and to roughly $85,000 in late November. By mid-December, it had stabilized near $88,000–$89,700.
November’s 25% drop was Bitcoin’s worst month since 2022. But unlike in 2022, no major crypto project collapsed, no stablecoin depegged, and no major exchange failed. The damage came from macro fears, not internal weaknesses — an important difference.
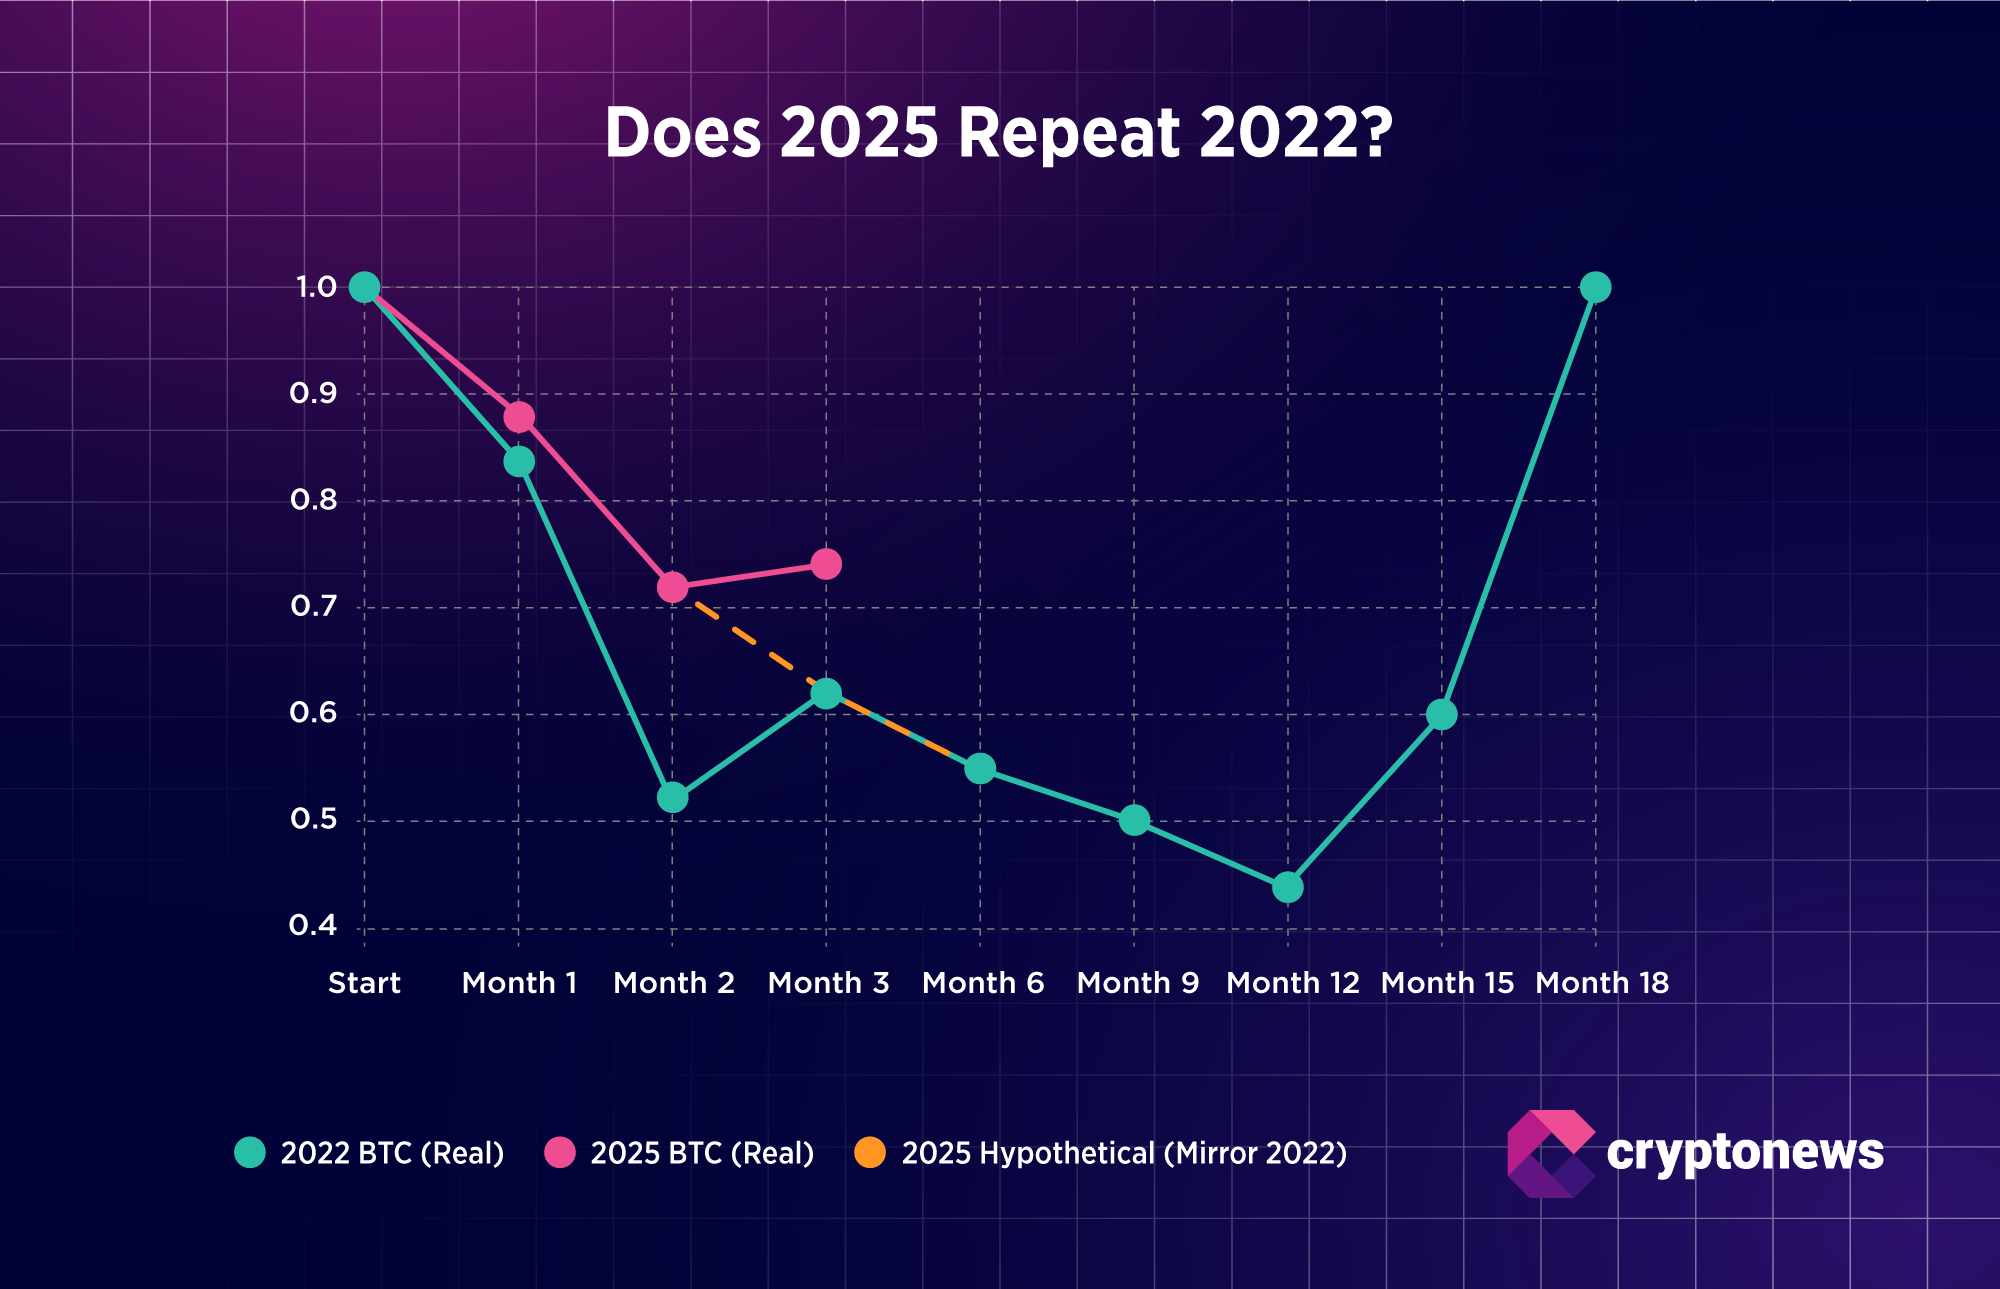
Price Patterns: 2022 vs. 2025
To compare both cycles, we normalize each one at its trigger point (May 3, 2022, and October 10, 2025).
In Month 1, both cycles fell at similar speed.In Month 2, the paths diverged sharply.
By Month 3, 2025 shows early stabilization, while 2022 remained unstable.
This gap shows that the 2025 decline is milder and has not entered a full capitulation phase.
What Exchange Flows Tell Us
Exchange flows are a useful way to read market sentiment. When more Bitcoin moves onto exchanges (inflows), it often means investors are preparing to sell. When more Bitcoin leaves exchanges (outflows), it usually points to accumulation or less interest in selling. In 2022, May and June saw heavy net inflows of about 150,000 BTC during the panic that followed the Terra/Luna collapse. At the same time, spot trading volumes on centralized exchanges fell from $1.94 trillion in May to $1.41 trillion in June and $1.39 trillion in July, showing that fewer people were trading as the bear market deepened.
In 2025, the picture is mixed but more stable. Gross inflows in November were high (around 580,000 BTC), but net flows actually turned negative, meaning more Bitcoin left exchanges than entered. This often signals quiet accumulation. Exchange reserves dropped to 2.76 million BTC, suggesting long-term holders and institutions are removing coins from trading venues.
The chart below compares exchange monthly spot volumes. It shows that spot volumes in 2025 remain stronger despite the correction. Binance, for example, saw $7.5 billion in whale inflows over the 30 days from late November to early December. But by mid-December, those inflows had dropped sharply, from 88,000 BTC per day to 21,000 BTC.
If 2025 Repeats 2022, How Long Could Recovery Take?
Bitcoin took 16-20 months to fully recover from the 2022 crash and more than a year from its bottom. Ethereum took even longer.
If the 2025 cycle copies that timeline, recovery could take 12–18 months. Bitcoin could retest the 0.62 normalized level, around $77,500, before reversing.
However, today’s market structure is stronger, liquidity is deeper, and no crypto-native crisis is unfolding. Still, several external forces could influence how quickly the market recovers.
Looking Toward 2026
Expectations for 2026 remain highly uncertain. While some analysts still see room for rate cuts next year, recent Fed projections point to only one at most, and policymakers remain divided. Any easing or liquidity support could help risk assets, though recent moves show that Bitcoin does not always react in a straight line. With steady ETF demand, some forecasts — including JPMorgan’s — still outline scenarios where Bitcoin reaches much higher levels.
At the same time, stickier inflation, stronger U.S. data, and geopolitical tensions could delay policy shifts or keep conditions tight. If ETF inflows cool or institutions turn more cautious, Bitcoin may spend longer moving sideways rather than building a new rally.
The post Bitcoin 2025 Crash: Why It Looks Different from 2022 appeared first on Cryptonews.
Other news